Security & Compliance
Built differently, secured similarly?


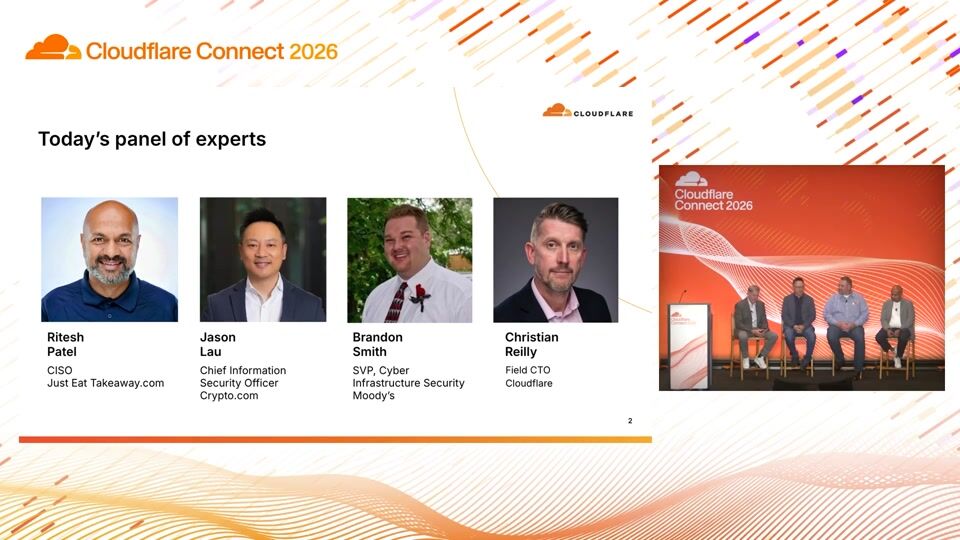
Ritesh Patel, Jason Lau
Just Eat Takeaway.com · Crypto.com
0:03So my name is Rian. I support the product team, an amazing team of product managers and systems engineers that run both our data side and our observability side. On the data side, we run the largest ClickHouse instance in the world. We like to say that we're more ClickHouse than ClickHouse, which I don't think they like that, but it's quite a massive scale that we operate in. So that's how we get all the data from the edge. into our data warehouse, into a place where it can get queried. And then on the observability side, our team makes that data useful for all of you. And so today, I'm actually really excited about this one because I did a similar talk two months ago at Connect in Sydney. And there, I kept having to say, and this is coming, and this is coming, and this is coming.
0:51But because of birthday week a couple of weeks ago today, I can say, and it's now here. The stuff I'm going to send you today is not mock-ups. The stuff I'm showing you today is actually live from the site and brand new. So it's a really, really cool time to do this talk. So I'm going to tell you a little bit about where Cloud4Observability is heading. We had some team changes at the beginning of the year. That's really, I think, really good for all of you. And then we're just going to go through all of the products, examining one slow request on a real website that I run. of show you all the things that you can do with Observability now that we have one team working on all of it. So I run a little site called Listentomore .com, it's a music discovery site that tells you about the stuff you listen to, it's built on Cloudflare of course, very successful, it has dozens of users, dozens of them, so it is really, really, really cool.
1:48But the reason I'm talking to you about it today is, I actually use, I use, I use, I use, all our tools to find a real issue on this site, so it ended up being a very good way to do this talk. So it makes calls to APIs of Spotify, Last .fm, which if you're old like me, that's a really old reference. If anyone still remembers Last .fm, they're still around. There we go. Yeah, you should use this. It's very good. And then it provides AI summaries and things like that. It's just a little side project. But let's say, for instance, imagine that someone tells me, you that search works but it's really really slow or you hear from your customers that something goes wrong in the past until about two weeks ago it was very possible for you if you had all your observability set up correctly on Cloudflare to figure that out to find the answer to that the problem is you had to go to a bunch of different places we have workers logs in one place you have if you subscribe to log Explorer you have security events in a different place um then you and then also there we also have the analytics page where some of that lives bot management page where all the WAF rules live so um you had to do what you really shouldn't be doing which is copy Ray IDs everywhere who's had to copy a Ray ID across the oh I'm so sorry I
3:09don't be mad we're fixing it so um that was all in different places right so in March this year we merged all those teams and particularly the workers observability team that that ran that product as well as the team that runs the security data sets and all the other logging that we do log push issue export your logs all that is now one team and so what you'll see from today but also in the future is that we have this vision for a single place for you and your agents to do the following now first of all if anyone's playing a drinking game about how many times we say agents today you're probably not in a good state right now so i apologize i'm going to say it a lot too but there's a reason for it and i will i will tell you about it so there's three things we want you to see everything about your application and the things that you build in one place want to bring your logs your events your traces all into the same place we want you to be able to use a single query language for that particularly the language that agents like, which is SQL.
4:14We invested heavily in GraphQL many years ago when that was a thing. Who hates GraphQL? Again, I'm sorry, we do too. All of that is changing where you'll be able to, we're about to get parity between the SQL API and the GraphQL API if you query our GraphQL API for analytics. And then thirdly, to act on what you find, you need to be able for you. and again your agents to see when something goes wrong and increasingly to fix it without you even knowing about it, test it, and tell you if it worked or not. So that's really what we're working on. So I'm going to show you a little bit today in this walkthrough about what's already here, which is a shared home for events, request on agent tracing, and how to set up customer alerting, customer monitoring using SQL.
5:03You'll see it's not all there yet, so what's coming, and I might touch on this in the end again if I have a little time. is more data sets and more export coverage on the log push side. If you export logs, we're about to introduce metrics log push, so you can export open telemetry logs and your traces as well. Easier investigation across data sets so that you can do joins across different kinds of data sets, as well as getting much better, again, at the recommendations that we do and having... what we call control network automation so that we can make changes in your code safely for you and test it and roll it back if it doesn't work. All right, so let's go back to the slow search.
5:49Let's say one of my dozen customers came to me and said the slow is very search on the site, slow on the site. We now have, and you'll see this in your dashboard, one place on the navigation that's just one place called observability. And if you go to observability, logs you will see all of this in there you'll see from this gif for example i'm also i'm old so it's gif not gif uh you'll see that you're able to select your data set at the top there right now i'm looking at http request and once the gif loops you'll see there are i only have a few data sets here but you can select any of the data sets you're subscribed to here you can see the graphing you can see here how many attacks were for some reason the bots really like my site so you can see all the things that happened there.
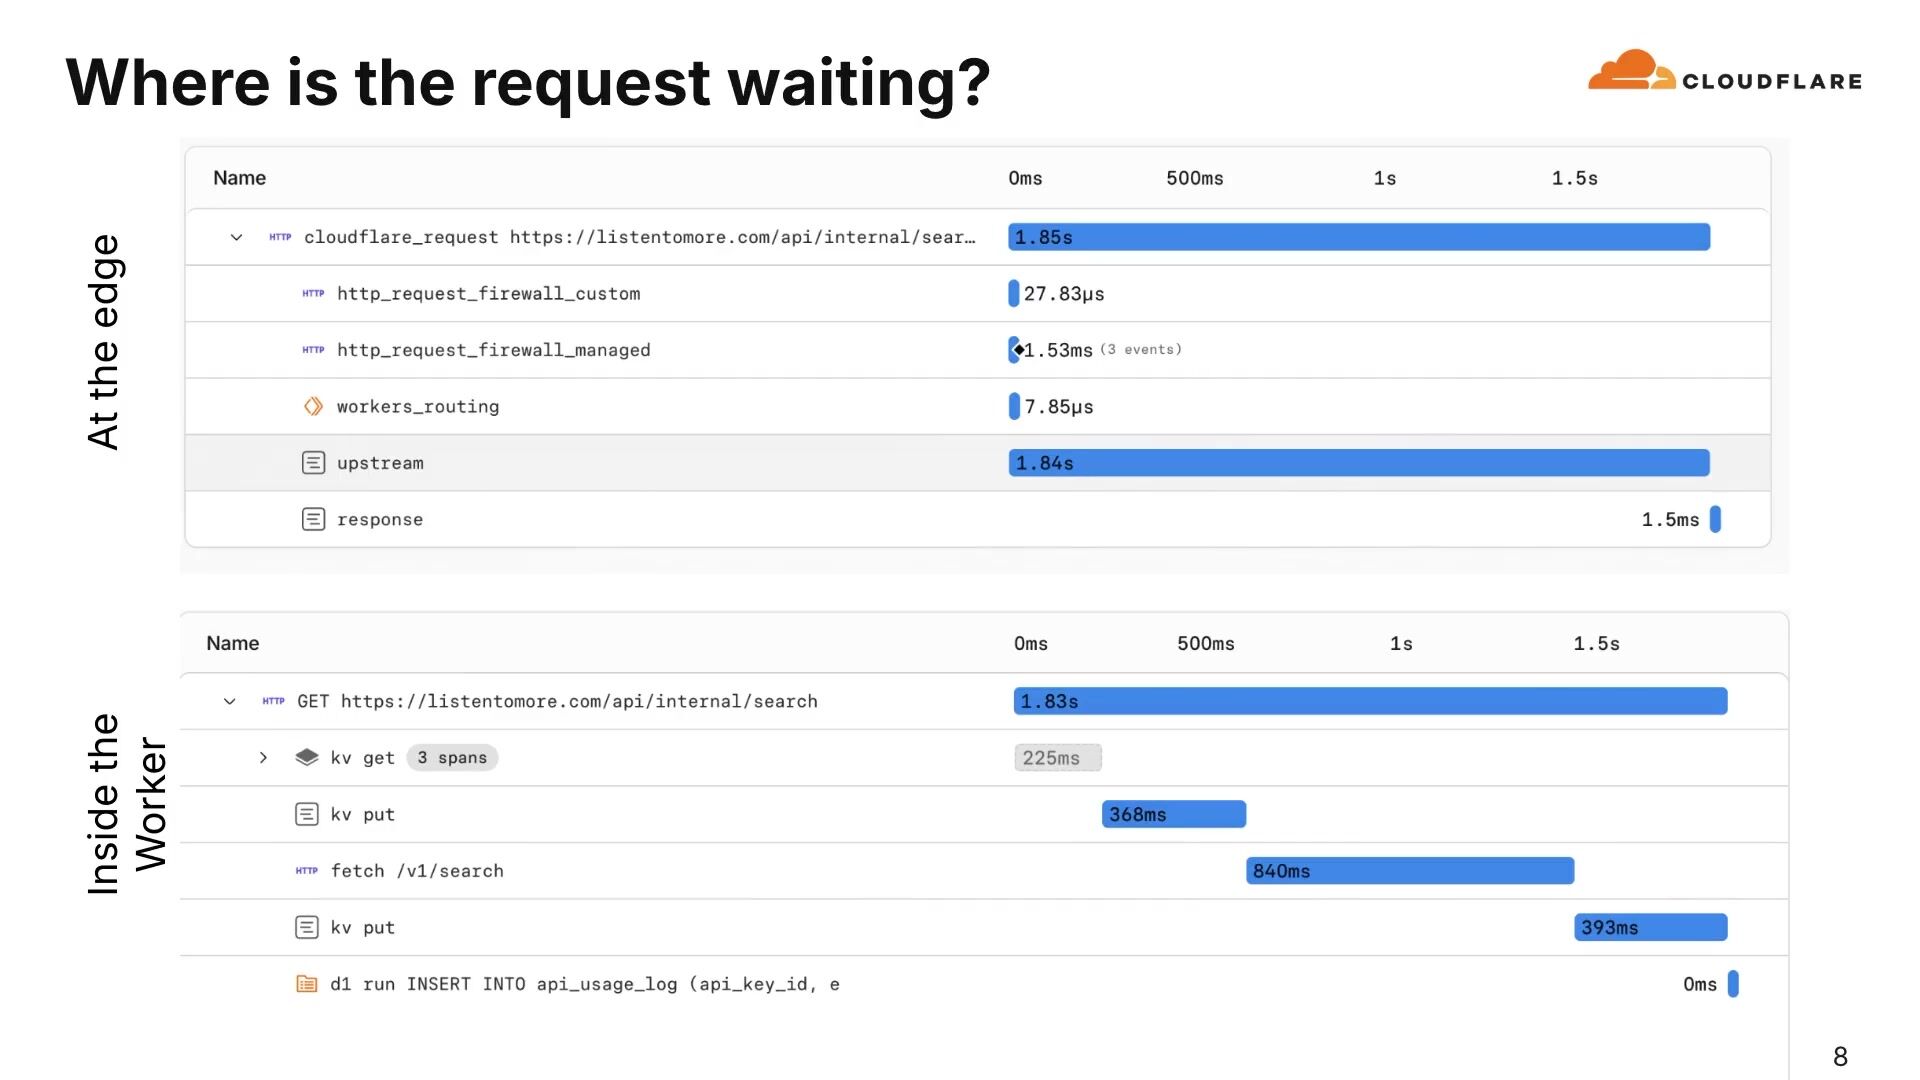
6:34This doesn't help me yet though. I need to find the slowness. So we have rolled out extremely advanced filters for this. So in this case, you'll see the top there. I wrote simple SQL. I don't have to do it in SQL. I can do it in SQL or just use the filtering to say, all right, only look at this end point and show me every request that took longer than a second. And now we've narrowed the logs down that you can can see here to a few of them you'll see the one i i put there in in red took 1 .8 seconds and now i'm able to start looking at that and say okay let's look at this one request let's click into that let's look at the tracing and let's see what actually happened here you heard rita this morning talking if you were at the keynote you heard rita talking about cloud for tracing which is our end to end tracing meaning we can tell you everything that happened from the minute the customer made everything that happens in your worker all the way to the end and so in this case you'll see a few things here in this particular case things that happen at the edge one problem here is and this is something that is still coming I'm show you the real stuff you see upstream is this black box of 1.84 seconds that's the worker doing its thing and we don't join that yet that is coming in an upcoming release but for now in in the future this will all be one thing so now like okay what's happening with that worker it's taking a long time and that's why you see at the bottom here that that's what's actually happened in that in that search you'll see for instance
8:07if you're a developer here i'm not but apparently what i'm doing wrong is that those kv puts should don't have to be there if i can that that can come later so i can make this i can immediately cut uh what is it seven milliseconds seven point seven seconds off this request by just moving those KB puts to another place. And that, even if that is what this stuff tells us from the tracing and from seeing what happens to the request, not just within the worker, but all the way through. I can see, oh, the length was longer in the worker and here's what actually happened in the worker. So that's what tracing gives you, the place to act. Once you've figured out what the issue is, you can then go from there. I also want to dig it a little bit.
8:53into AI tracing, not directly related to this specific example. But if you haven't set that up yet, it's really easy to do if you use workers AI. Has any of you set that up? Not enough. All right, so set that up immediately. It's really easy to do. It's one line in your Wrangler file, and then you can figure out where each AI call spend its time. And that's super useful to understand. This one's pretty simple, but if you have... especially long-running agents running and things that make complicated calls to different APIs, it's a really good way to figure out what's actually happening with your agents, where slowness might be happening. It also shows you all the responses, where the responses might have gone wrong, the token usage, all that kind of stuff is involved in that.
9:42So agent tracing in this case, here's another trace that just shows you exactly what happened here. In my case, you'll see I did... 10,000 input tokens and only 74 out. That's because I accidentally had web search on, I found out. So if I turn web search on, obviously my input tokens is going to reduce dramatically. And I only found that out because I have agent tracing on this site. The thing I'm really excited about is that anything you can ask or any SQL query that you can build or any graph that you... can build on Cloudflare, you can now alert on, and that is really, really cool. So again, this is part of our unified observability. So if you go to the top level of your account, you will again see it there under observability, under alerting, you can set up monitors.
10:30So in this case, I just kept this thing going. This is a simple SQL query that says every time, well, if a search takes more than once more than one second 10 times in a row send me an alert but that's just one example again the really powerful thing here is if you or let's be honest your agent can write a SQL query you can alert on it and that's again live now and then from there we are really working on turning that into a monitor not just in the usual way in terms of send it to slack or send it to a webhook but you'll see here, coding agent.
11:16You can send these alerts directly to coding agents and it'll go look at it for you and try to fix it or do whatever you need to be doing with it. So that's another thing I would really encourage you all to play with is once you have workers' observability turned on and once you have agent tracing turned on and then once you write a SQL query against the things that you care about and alert on it, this stuff becomes really, really powerful. So in this case, I just set up a Discord webhook and it sends me a notification if that search is very, very slow.
11:53Right, another thing is, so that was the full tracing from start to finish. The other thing I wanted to talk about is our LogPush product. Now, LogPush allows you to export your logs to a third party like Datadog or Grafano or any. any of those other things that you might already be using for us as a team it's it's interesting because they're competitors and partners and so but the way we look at it is if you there are very legitimate reasons for people for you to want to export your logs that's usually related to compliance so if you work in a high in a in a in an industry that has high compliance like finance or health and you need those logs somewhere else if you want longer retention you want to keep your logs for a year instead of seven days or 30 days that's another good reason to do it and the other big one is you want the the mythical single pane of glass you want to get all your logs in the same place not just in cloudflare those to us are legitimate reasons for using export if you export your logs because our logs aren't good enough that's a different story and then you please have to write down on my name and tell me about it because that we want to fix if if we're like, no, your log sucks, so we're going to export it to Datadog. That's not good.
13:06But there are very legitimate reasons for exporting these things. And one of the recent things we launched in this as well is the ability to transform logs before you export it. What most people use this for is to reduce fields that they don't care about, to reduce costs. But again, if you can write SQL for it, you can transform your log. This is based on SQL. In this case, if you can see it, And again, all this does is it says if I have a log line where the search is longer than a second, add that field that said is slow is true and add that to the log. And you can see there I was able to test it, see what's happening with it, and then attach it to a log push job.
13:55So if you export your log somewhere else, you're not able to do any kind of transformation, add fields to it, remove fields to it. do computations on it, anything you can do with the SQL so that if you use this in your own tools already, you're able to make that more helpful for you. So where we're going with this is, again, the one place for you and your agents to see, ask, and act. And I want to come back to the agents thing because I think for those of us who work in observability, a big north star for all of us has always been. how can we make this data more useful? How can we make prettier graphs? How can we make the graphs easier to make? Increasingly, that's not what we see. So we are now seeing over 50% of the queries on our ClickHouse instance being from agents.
14:47And that means, that doesn't maybe not sound as impressive as Matthew's number from this morning, but you have to understand that our dashboard uses these queries, so every time you open it, dashboard. Every time you do anything within Cloudflare, that's a query to our data and to our observability. What we're seeing now is this massive growth where people are simply not creating dashboards anymore. They're just asking a question and our MCPs or our CLI goes and find the answer and tells them and make their own dashboard somewhere else. I'm assuming this resonates with all of you because you all probably do the same thing. You don't go make a custom dashboard anymore. You ask, questions. So I want to let you all know we see that and we know that and our focus is not on making video graphs. Our focus is on making sure that when you tell your agents to do this stuff, they know what to do and they're able to do it very easily.
15:38And there's a couple of ways to do that. First of all, like I said, the SQL API, and then also to make sure that the new CLI, the CFCLI covers every single thing that we have. If you haven't tried CFCLI yet, which is our CLI tool that has the entire API surface, a very cool thing to do. It has an 011i observability, OLLI command built in. So anything here that you see that I show today, your agent should just be able to check it for you. So we want you to be able to start from a shared view of events. We want you to be able to use traces and SQL to investigate. And then almost the most important thing, we want you to be able to set monitors on these for anything. that either send monitors and alerts to you or to agents to be able to fix that.
16:29So I know everyone says we're just beginning and all that stuff, but I can really say that we've only started this journey in March. Birthday week a couple of weeks ago was huge and we see an immense growth in people who set up custom alerts, people who turn on agent tracing and Cloudflare tracing. And I'd love for all of you to try it as well and let us know how it goes because we have... a lot more to do and we want to make sure that we do it with you all. So that's kind of where we are with observability and where we're going. All right, thanks everyone. Appreciate you.
Ritesh Patel, Jason Lau
Just Eat Takeaway.com · Crypto.com
Tyler Greenfield
SentinelOne
Craig Strubhart, Ryan LaSalle
Cloudflare · Nisos
Be the first to know when registration opens and the agenda goes live.
---
title: "Unifying network observability: Logs, traces, and the agents you run"
url: "https://www.cloudflare.com/connect/2026/session/unifying-network-observability-logs-traces-and-the-agents-you-run"
year: 2026
---

# Unifying network observability: Logs, traces, and the agents you run

[Watch session](https://www.cloudflare.com/connect/2026/session/unifying-network-observability-logs-traces-and-the-agents-you-run)

## Session details

- **Track:** Security & Compliance
- **Topics:** SecOps & automation, AI security & audit, Performance & resiliency
- **Solution areas:** Developer Platform, Core Platform, Application Security

## About this session

This session is tailored for developers, platform teams, and security engineers who troubleshoot on Cloudflare. Logs, analytics, traces, and alerts have lived in separate products with separate query languages, so one question means multiple tabs. This session shows what changes when they become one product and what benefits it brings: one query language to learn, answers without standing up a pipeline first, and alerts on anything you can query. Also learn about observability for the AI agents you build on Cloudflare Workers and where the network starts fixing what it can on its own. You will leave knowing what this replaces in your setup and how to get your telemetry into the tools you already run.

## Speakers

- [Rian van der Merwe](https://www.cloudflare.com/connect/speakers/2421537) — Senior Director of Product, Data & Observability, Cloudflare

## Transcript

[0:03] So my name is Rian. I support the product team, an amazing team of product managers and systems engineers that run both our data side and our observability side. On the data side, we run the largest ClickHouse instance in the world. We like to say that we're more ClickHouse than ClickHouse, which I don't think they like that, but it's quite a massive scale that we operate in. So that's how we get all the data from the edge. into our data warehouse, into a place where it can get queried. And then on the observability side, our team makes that data useful for all of you. And so today, I'm actually really excited about this one because I did a similar talk two months ago at Connect in Sydney. And there, I kept having to say, and this is coming, and this is coming, and this is coming.

[0:51] But because of birthday week a couple of weeks ago today, I can say, and it's now here. The stuff I'm going to send you today is not mock-ups. The stuff I'm showing you today is actually live from the site and brand new. So it's a really, really cool time to do this talk. So I'm going to tell you a little bit about where Cloud4Observability is heading. We had some team changes at the beginning of the year. That's really, I think, really good for all of you. And then we're just going to go through all of the products, examining one slow request on a real website that I run. of show you all the things that you can do with Observability now that we have one team working on all of it. So I run a little site called Listentomore .com, it's a music discovery site that tells you about the stuff you listen to, it's built on Cloudflare of course, very successful, it has dozens of users, dozens of them, so it is really, really, really cool.

[1:48] But the reason I'm talking to you about it today is, I actually use, I use, I use, I use, all our tools to find a real issue on this site, so it ended up being a very good way to do this talk. So it makes calls to APIs of Spotify, Last .fm, which if you're old like me, that's a really old reference. If anyone still remembers Last .fm, they're still around. There we go. Yeah, you should use this. It's very good. And then it provides AI summaries and things like that. It's just a little side project. But let's say, for instance, imagine that someone tells me, you that search works but it's really really slow or you hear from your customers that something goes wrong in the past until about two weeks ago it was very possible for you if you had all your observability set up correctly on Cloudflare to figure that out to find the answer to that the problem is you had to go to a bunch of different places we have workers logs in one place you have if you subscribe to log Explorer you have security events in a different place um then you and then also there we also have the analytics page where some of that lives bot management page where all the WAF rules live so um you had to do what you really shouldn't be doing which is copy Ray IDs everywhere who's had to copy a Ray ID across the oh I'm so sorry I

[3:09] don't be mad we're fixing it so um that was all in different places right so in March this year we merged all those teams and particularly the workers observability team that that ran that product as well as the team that runs the security data sets and all the other logging that we do log push issue export your logs all that is now one team and so what you'll see from today but also in the future is that we have this vision for a single place for you and your agents to do the following now first of all if anyone's playing a drinking game about how many times we say agents today you're probably not in a good state right now so i apologize i'm going to say it a lot too but there's a reason for it and i will i will tell you about it so there's three things we want you to see everything about your application and the things that you build in one place want to bring your logs your events your traces all into the same place we want you to be able to use a single query language for that particularly the language that agents like, which is SQL.

[4:14] We invested heavily in GraphQL many years ago when that was a thing. Who hates GraphQL? Again, I'm sorry, we do too. All of that is changing where you'll be able to, we're about to get parity between the SQL API and the GraphQL API if you query our GraphQL API for analytics. And then thirdly, to act on what you find, you need to be able for you. and again your agents to see when something goes wrong and increasingly to fix it without you even knowing about it, test it, and tell you if it worked or not. So that's really what we're working on. So I'm going to show you a little bit today in this walkthrough about what's already here, which is a shared home for events, request on agent tracing, and how to set up customer alerting, customer monitoring using SQL.

[5:03] You'll see it's not all there yet, so what's coming, and I might touch on this in the end again if I have a little time. is more data sets and more export coverage on the log push side. If you export logs, we're about to introduce metrics log push, so you can export open telemetry logs and your traces as well. Easier investigation across data sets so that you can do joins across different kinds of data sets, as well as getting much better, again, at the recommendations that we do and having... what we call control network automation so that we can make changes in your code safely for you and test it and roll it back if it doesn't work. All right, so let's go back to the slow search.

[5:49] Let's say one of my dozen customers came to me and said the slow is very search on the site, slow on the site. We now have, and you'll see this in your dashboard, one place on the navigation that's just one place called observability. And if you go to observability, logs you will see all of this in there you'll see from this gif for example i'm also i'm old so it's gif not gif uh you'll see that you're able to select your data set at the top there right now i'm looking at http request and once the gif loops you'll see there are i only have a few data sets here but you can select any of the data sets you're subscribed to here you can see the graphing you can see here how many attacks were for some reason the bots really like my site so you can see all the things that happened there.

[6:34] This doesn't help me yet though. I need to find the slowness. So we have rolled out extremely advanced filters for this. So in this case, you'll see the top there. I wrote simple SQL. I don't have to do it in SQL. I can do it in SQL or just use the filtering to say, all right, only look at this end point and show me every request that took longer than a second. And now we've narrowed the logs down that you can can see here to a few of them you'll see the one i i put there in in red took 1 .8 seconds and now i'm able to start looking at that and say okay let's look at this one request let's click into that let's look at the tracing and let's see what actually happened here you heard rita this morning talking if you were at the keynote you heard rita talking about cloud for tracing which is our end to end tracing meaning we can tell you everything that happened from the minute the customer made everything that happens in your worker all the way to the end and so in this case you'll see a few things here in this particular case things that happen at the edge one problem here is and this is something that is still coming I'm show you the real stuff you see upstream is this black box of 1.84 seconds that's the worker doing its thing and we don't join that yet that is coming in an upcoming release but for now in in the future this will all be one thing so now like okay what's happening with that worker it's taking a long time and that's why you see at the bottom here that that's what's actually happened in that in that search you'll see for instance

[8:07] if you're a developer here i'm not but apparently what i'm doing wrong is that those kv puts should don't have to be there if i can that that can come later so i can make this i can immediately cut uh what is it seven milliseconds seven point seven seconds off this request by just moving those KB puts to another place. And that, even if that is what this stuff tells us from the tracing and from seeing what happens to the request, not just within the worker, but all the way through. I can see, oh, the length was longer in the worker and here's what actually happened in the worker. So that's what tracing gives you, the place to act. Once you've figured out what the issue is, you can then go from there. I also want to dig it a little bit.

[8:53] into AI tracing, not directly related to this specific example. But if you haven't set that up yet, it's really easy to do if you use workers AI. Has any of you set that up? Not enough. All right, so set that up immediately. It's really easy to do. It's one line in your Wrangler file, and then you can figure out where each AI call spend its time. And that's super useful to understand. This one's pretty simple, but if you have... especially long-running agents running and things that make complicated calls to different APIs, it's a really good way to figure out what's actually happening with your agents, where slowness might be happening. It also shows you all the responses, where the responses might have gone wrong, the token usage, all that kind of stuff is involved in that.

[9:42] So agent tracing in this case, here's another trace that just shows you exactly what happened here. In my case, you'll see I did... 10,000 input tokens and only 74 out. That's because I accidentally had web search on, I found out. So if I turn web search on, obviously my input tokens is going to reduce dramatically. And I only found that out because I have agent tracing on this site. The thing I'm really excited about is that anything you can ask or any SQL query that you can build or any graph that you... can build on Cloudflare, you can now alert on, and that is really, really cool. So again, this is part of our unified observability. So if you go to the top level of your account, you will again see it there under observability, under alerting, you can set up monitors.

[10:30] So in this case, I just kept this thing going. This is a simple SQL query that says every time, well, if a search takes more than once more than one second 10 times in a row send me an alert but that's just one example again the really powerful thing here is if you or let's be honest your agent can write a SQL query you can alert on it and that's again live now and then from there we are really working on turning that into a monitor not just in the usual way in terms of send it to slack or send it to a webhook but you'll see here, coding agent.

[11:16] You can send these alerts directly to coding agents and it'll go look at it for you and try to fix it or do whatever you need to be doing with it. So that's another thing I would really encourage you all to play with is once you have workers' observability turned on and once you have agent tracing turned on and then once you write a SQL query against the things that you care about and alert on it, this stuff becomes really, really powerful. So in this case, I just set up a Discord webhook and it sends me a notification if that search is very, very slow.

[11:53] Right, another thing is, so that was the full tracing from start to finish. The other thing I wanted to talk about is our LogPush product. Now, LogPush allows you to export your logs to a third party like Datadog or Grafano or any. any of those other things that you might already be using for us as a team it's it's interesting because they're competitors and partners and so but the way we look at it is if you there are very legitimate reasons for people for you to want to export your logs that's usually related to compliance so if you work in a high in a in a in an industry that has high compliance like finance or health and you need those logs somewhere else if you want longer retention you want to keep your logs for a year instead of seven days or 30 days that's another good reason to do it and the other big one is you want the the mythical single pane of glass you want to get all your logs in the same place not just in cloudflare those to us are legitimate reasons for using export if you export your logs because our logs aren't good enough that's a different story and then you please have to write down on my name and tell me about it because that we want to fix if if we're like, no, your log sucks, so we're going to export it to Datadog. That's not good.

[13:06] But there are very legitimate reasons for exporting these things. And one of the recent things we launched in this as well is the ability to transform logs before you export it. What most people use this for is to reduce fields that they don't care about, to reduce costs. But again, if you can write SQL for it, you can transform your log. This is based on SQL. In this case, if you can see it, And again, all this does is it says if I have a log line where the search is longer than a second, add that field that said is slow is true and add that to the log. And you can see there I was able to test it, see what's happening with it, and then attach it to a log push job.

[13:55] So if you export your log somewhere else, you're not able to do any kind of transformation, add fields to it, remove fields to it. do computations on it, anything you can do with the SQL so that if you use this in your own tools already, you're able to make that more helpful for you. So where we're going with this is, again, the one place for you and your agents to see, ask, and act. And I want to come back to the agents thing because I think for those of us who work in observability, a big north star for all of us has always been. how can we make this data more useful? How can we make prettier graphs? How can we make the graphs easier to make? Increasingly, that's not what we see. So we are now seeing over 50% of the queries on our ClickHouse instance being from agents.

[14:47] And that means, that doesn't maybe not sound as impressive as Matthew's number from this morning, but you have to understand that our dashboard uses these queries, so every time you open it, dashboard. Every time you do anything within Cloudflare, that's a query to our data and to our observability. What we're seeing now is this massive growth where people are simply not creating dashboards anymore. They're just asking a question and our MCPs or our CLI goes and find the answer and tells them and make their own dashboard somewhere else. I'm assuming this resonates with all of you because you all probably do the same thing. You don't go make a custom dashboard anymore. You ask, questions. So I want to let you all know we see that and we know that and our focus is not on making video graphs. Our focus is on making sure that when you tell your agents to do this stuff, they know what to do and they're able to do it very easily.

[15:38] And there's a couple of ways to do that. First of all, like I said, the SQL API, and then also to make sure that the new CLI, the CFCLI covers every single thing that we have. If you haven't tried CFCLI yet, which is our CLI tool that has the entire API surface, a very cool thing to do. It has an 011i observability, OLLI command built in. So anything here that you see that I show today, your agent should just be able to check it for you. So we want you to be able to start from a shared view of events. We want you to be able to use traces and SQL to investigate. And then almost the most important thing, we want you to be able to set monitors on these for anything. that either send monitors and alerts to you or to agents to be able to fix that.

[16:29] So I know everyone says we're just beginning and all that stuff, but I can really say that we've only started this journey in March. Birthday week a couple of weeks ago was huge and we see an immense growth in people who set up custom alerts, people who turn on agent tracing and Cloudflare tracing. And I'd love for all of you to try it as well and let us know how it goes because we have... a lot more to do and we want to make sure that we do it with you all. So that's kind of where we are with observability and where we're going. All right, thanks everyone. Appreciate you.

## Related sessions

- [Built differently, secured similarly?](https://www.cloudflare.com/connect/2026/session/built-differently-secured-similarly)
- [From the endpoint to the edge: Simplifying security in the AI era](https://www.cloudflare.com/connect/2026/session/from-the-endpoint-to-the-edge-simplifying-security-in-the-ai-era)
- [Rethinking insider risk for a workforce of people and agents](https://www.cloudflare.com/connect/2026/session/rethinking-insider-risk-for-a-workforce-of-people-and-agents)

## More from Connect

- [All sessions](https://www.cloudflare.com/connect/)
- [Get notified for Connect 2027](https://www.cloudflare.com/connect#2027)

